Research

The creator economy, by the numbers

Creators make what we watch. Platforms keep most of the money.

Advertisers were forecast to spend $306.4 billion on social media in 2025.3 Here’s how much of it reaches the people who make the posts, videos and streams those ads run beside.

One company was forecast to take 60.1% of the world’s social media ad spend in 2025.3

What it earned, what it kept, and what it paid creators

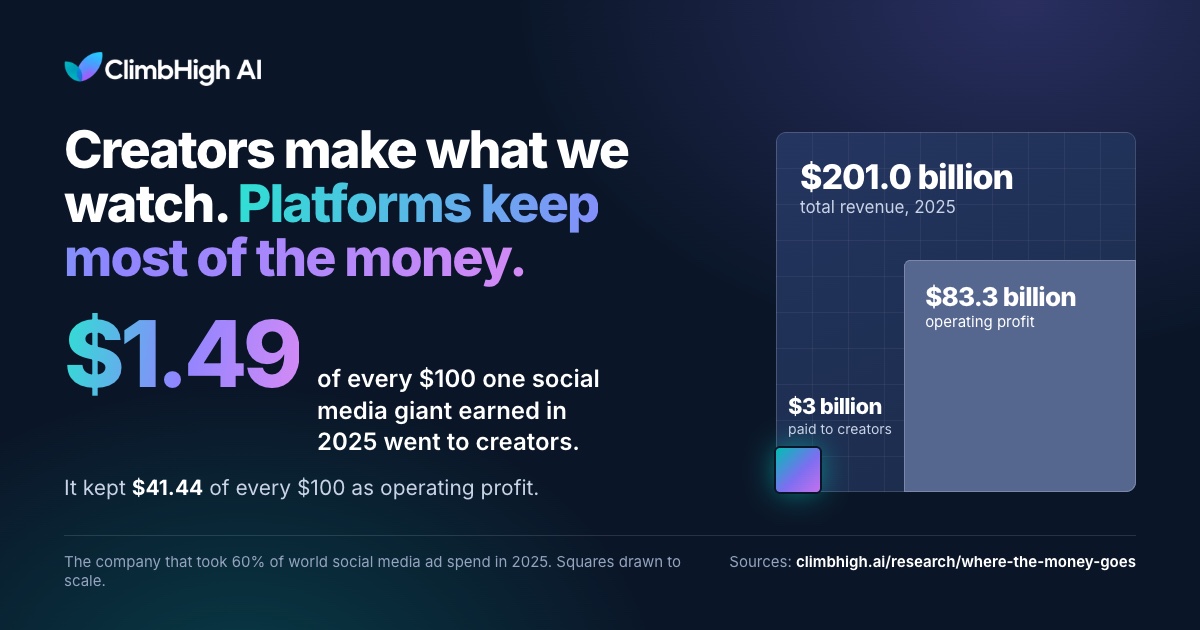
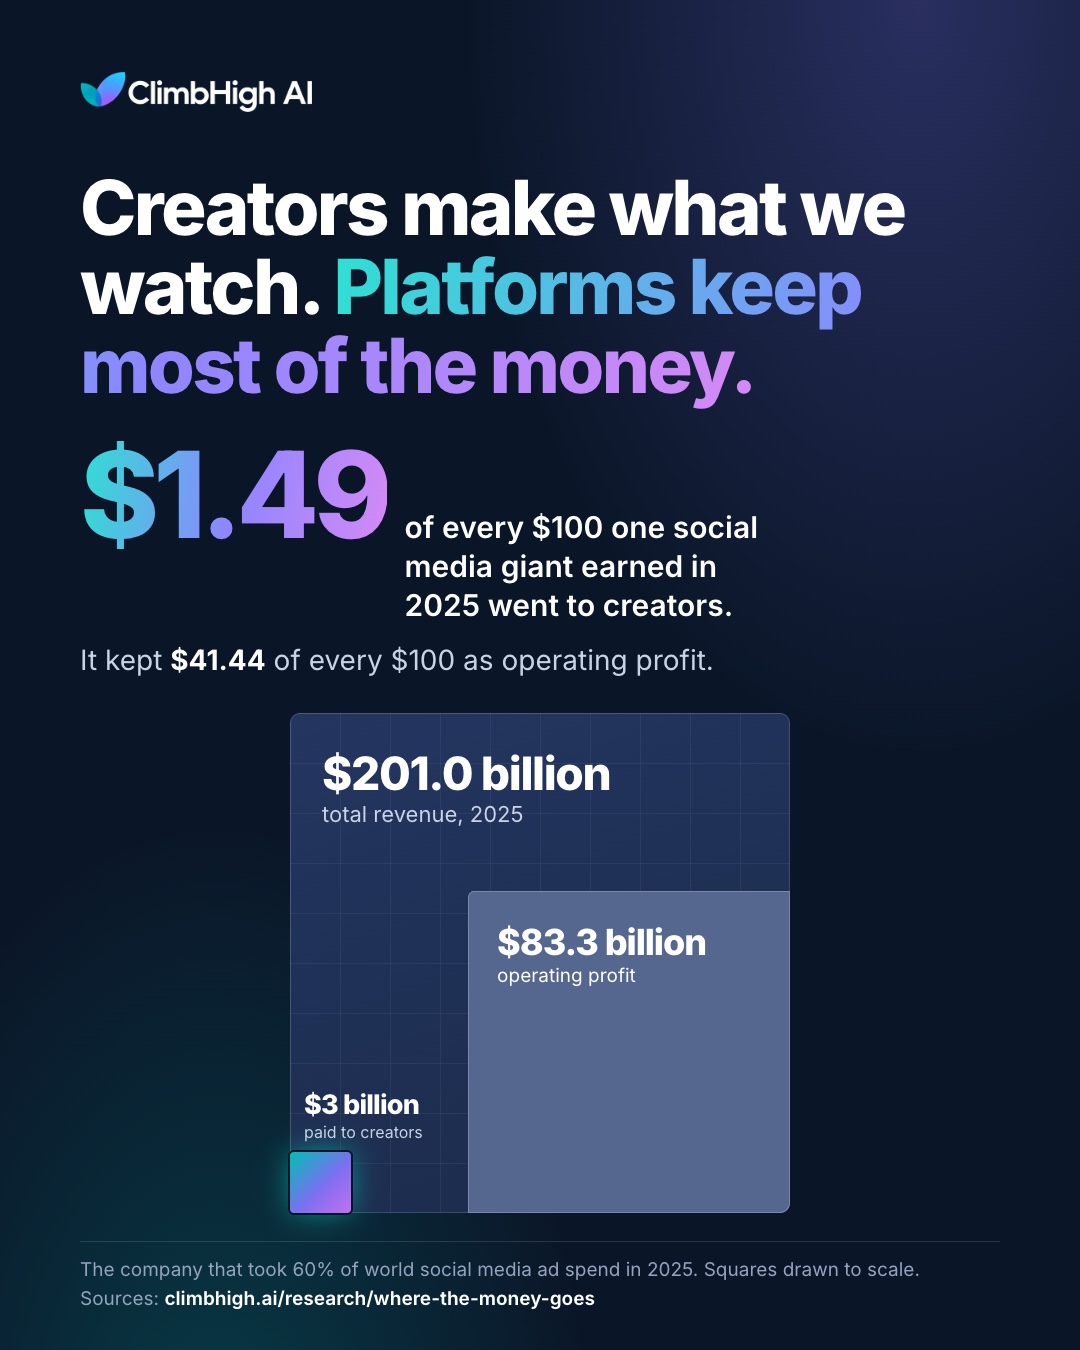
$1.49 of every $100 it earned went to creators.

It kept $41.44 of every $100 as operating profit: about 28 times what it paid creators.

Revenue and operating profit are the whole company’s; 97.6% of revenue came from advertising.1 Operating profit is what it kept after all its costs, creator pay included. Payouts are the nearly $3 billion its flagship social app paid through creator programs, up 35% on 2024.2 We found no published 2025 total for its other apps. Squares are drawn to scale by area.

The ten biggest platforms

What they earned and kept in 2025, and what they say they paid creators.

Four of the ten published a 2025 figure for what they paid or shared with creators. The other six took in at least $290 billion between them and published no 2025 total.

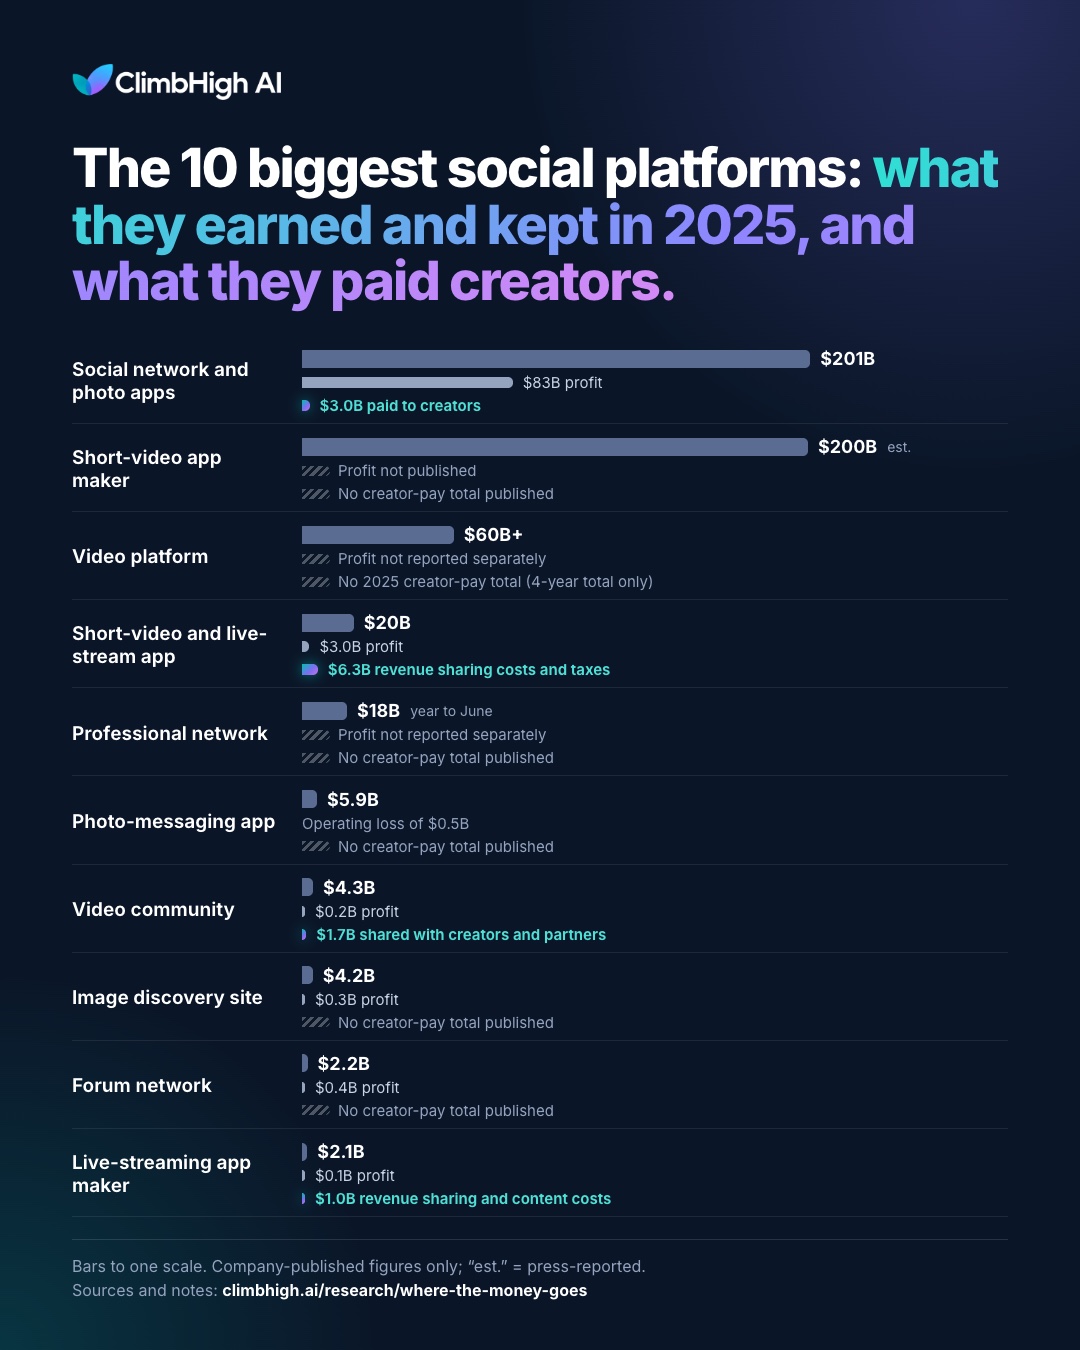
Bar chart of 2025 revenue and operating profit for the ten biggest social media platforms, with creator pay where the platform published it. Details for each platform follow.
  1. Social network and photo apps

    $201B revenue
    $83B operating profit
    $3.0B paid to creators on its main social app

    12

  2. Short-video app maker

    $200B est. revenue

    Profit not published

    No 2025 creator-pay total published

    12

  3. Video platform

    $60B+ revenue

    Profit not reported separately

    No 2025 total; $100B+ to creators, artists and media companies over four years

    5613

  4. Short-video and live-stream app

    $20B revenue
    $3.0B operating profit
    $6.3B “revenue sharing costs and related taxes” (no breakdown published)

    1417

  5. Professional network

    $18B year to June revenue

    Profit not reported separately

    No 2025 creator-pay total published

    15

  6. Photo-messaging app

    $5.9B revenue

    Operating loss of $0.5B

    No 2025 creator-pay total published

    16

  7. Video community

    $4.3B revenue
    $0.2B operating profit
    $1.7B shared with creators, live hosts, game developers, app stores and payment channels

    17

  8. Image discovery site

    $4.2B revenue
    $0.3B operating profit

    No 2025 creator-pay total published

    18

  9. Forum network

    $2.2B revenue
    $0.4B operating profit

    No 2025 creator-pay total published

    19

  10. Live-streaming app maker

    $2.1B revenue
    $0.1B operating profit
    $1.0B “revenue sharing fees and content costs”: paid to channel owners, performers and content providers, plus ad-network traffic costs

    22

2025 revenueOperating profitCreator pay the company publishedNo total published

Bars share one scale. Operating profit is what a company kept after all its costs, creator pay included. “est.” marks a private company’s revenue as reported by the press, not by the company. Yuan figures are converted at 6.9931 to the dollar. The creator-pay figures from video and live-stream apps are cost lines that also include other partners or taxes. We left out a messaging-and-games conglomerate, whose social media revenue isn’t reported apart from games and payments; a microblogging site that publishes only its advertising revenue, $1.8 billion, less than the tenth platform’s total;20 a private lifestyle-sharing app whose 2025 revenue we found only as analysts’ estimates; and third-party estimates of creator pay, which are modelled guesses rather than company figures.

Without creators, a social platform is an empty feed.

Yet the platforms that pay creators pay mostly for revenue they can trace to each creator’s own posts and videos.

What about everything else a platform earns, that it could never earn without what creators make?

The best case

Even the most generous pays only for what it can trace.

A video platform with more than $60 billion in 2025 revenue5 says it paid over $100 billion to creators, artists and media companies in four years.6 That’s real money. But it’s a share of the ads that run on each creator’s own videos.7 The platform those videos helped build isn’t part of the deal.

The creator’s share of ad revenue, by where the ad runs
  • Ads on a partner’s long-form video

    55% of the ad revenue7

  • Ads in the short-video feed

    45% of a pooled fund, split by views7

  • Ads on videos outside its partner program

    0% its terms say they don’t “entitle you to any payments”8

CreatorPlatform

The bigger picture

Creators are now the main event.

WPP Media’s 2025 forecast expected content made by users and creators to overtake professional production in ad revenue that year.4

  • $394.6B

    forecast for social media advertising worldwide in 2026, up 21.3% in a year21

  • $184.9B

    in ad revenue from creator-made content in 2025, up 20% in a year (forecast)4

  • $376.6B

    forecast for creator-content ad revenue by 20304

What the research says

Why the split looks like this

  1. Platforms set the terms

    Researchers who study platforms find that the people who make content have to keep adapting to platform rules and pricing they don’t control.9, 23

  2. The split is a design choice

    Economic models of ad-funded platforms treat revenue sharing as a design decision the platform makes, and partly a tug of war with creators.10

  3. “Free” leaves people out

    Economists have argued that treating what users contribute as free ignores their part in creating it and spreads the gains unequally.11

What we’re designing instead

We’re building ClimbHigh AI the other way around.

We believe paying creators only for revenue traced to their own content leaves out most of what they make possible. So the model we’re building toward reserves 67% of ClimbHigh AI’s ownership for creators, earned as pay for teaching on it.

Proposed model

Where this stands: This is the model we’re designing, not a final program. Nothing is final until counsel-approved agreements are signed, and every creator sees every term in writing before signing. Joining the waitlist is free and doesn’t earn, reserve or guarantee any ownership.

Ownership awards are compensation for content contributions, subject to program terms, written agreements, eligibility, and applicable law, and may vary or be unavailable in some countries. This is not an offer to sell or a solicitation to buy securities.
Use it

Share the chart

Link to this page, or download an image to post. Please keep the source line with it.

Sources and method

  • $1.49 of every $100 = $3 billion paid to creators ÷ $200.966 billion total revenue, both for 2025.
  • Company figures are as reported. Market figures are forecasts, labeled as such.
  • The charts name no platform; the sources below identify the documents. Every link and figure was checked on October 30, 2026.
  1. Meta Platforms, Inc. Annual report (Form 10-K) for fiscal year 2025. Filed with the U.S. SEC, January 2026. Total revenue $200,966 million; advertising $196,175 million. www.sec.gov/Archives/edgar/data/1326801/000162828026003942/meta-20251231.htm
  2. Meta Newsroom. “Creator Fast Track: A New Way to Quickly Grow Your Audience and Earn Money on Facebook.” March 18, 2026. Payouts of nearly $3 billion in 2025, up 35%. about.fb.com/news/2026/03/creator-fast-track-grow-your-audience-earn-money-on-facebook/
  3. WARC Media. Global ad forecast, Q3 2025 update (September 24, 2025), as reported by Mediaweek, “Global ad market forecast upgraded as social media spend surges,” September 26, 2025. Social media ad spend forecast to rise 14.9% to $306.4 billion in 2025; Meta expected to take $184.1 billion, 60.1% of it. WARC’s full report is for subscribers. www.mediaweek.com.au/data/global-ad-market-forecast-upgraded-as-social-media-spend-surges
  4. WPP Media. This Year Next Year: 2025 Global Midyear Forecast. June 10, 2025. Creator-generated ad revenue $184.9 billion in 2025, up 20%, more than half of content-driven ad revenue; $376.6 billion by 2030. www.nordics.wppmedia.com/news/tyny-midyear-2025
  5. Alphabet Inc. Fourth quarter and fiscal year 2025 results (earnings release). February 4, 2026. YouTube revenue across ads and subscriptions exceeded $60 billion for 2025. s206.q4cdn.com/479360582/files/doc_financials/2025/q4/2025q4-alphabet-earnings-release.pdf
  6. Mohan, N. “The future of YouTube: 2026.” YouTube Official Blog, January 21, 2026. Over $100 billion paid to creators, artists and media companies in the past four years. blog.youtube/inside-youtube/the-future-of-youtube-2026/
  7. YouTube Official Blog. “YouTube Partner Program explained.” February 3, 2025. Creators’ share of ad revenue: 55% for long-form videos, 45% for Shorts. blog.youtube/creator-and-artist-stories/youtube-partner-program-explained/
  8. YouTube Terms of Service, effective December 15, 2023. “Right to Monetize.” www.youtube.com/t/terms
  9. Nieborg, D. B., & Poell, T. (2018). The platformization of cultural production: Theorizing the contingent cultural commodity. New Media & Society, 20(11), 4275–4292. doi.org/10.1177/1461444818769694
  10. Bhargava, H. K. (2022). The creator economy: Managing ecosystem supply, revenue sharing, and platform design. Management Science, 68(7), 5233–5251. doi.org/10.1287/mnsc.2021.4126
  11. Arrieta-Ibarra, I., Goff, L., Jiménez-Hernández, D., Lanier, J., & Weyl, E. G. (2018). Should we treat data as labor? Moving beyond “free.” AEA Papers and Proceedings, 108, 38–42. doi.org/10.1257/pandp.20181003
  12. Proactive (via Yahoo Finance). “TikTok developer ByteDance profit drops as AI spending weighs.” September 15, 2026. 2025 revenue “about $200 billion,” as reported by The Information. Private company: not company-published. finance.yahoo.com/technology/ai/articles/tiktok-developer-bytedance-profit-drops-142800788.html
  13. Alphabet Inc. Annual report (Form 10-K) for fiscal year 2025. YouTube is reported inside the Google Services segment, with no separate operating income. www.sec.gov/Archives/edgar/data/1652044/000165204426000018/goog-20251231.htm
  14. Kuaishou Technology. Annual results announcement for the year ended December 31, 2025 (HKEX), March 25, 2026. Revenues RMB142,776 million; operating profit RMB20,637 million; revenue sharing costs and related taxes RMB43,859 million. www1.hkexnews.hk/listedco/listconews/sehk/2026/0325/2026032500367.pdf
  15. Microsoft Corporation. Annual report (Form 10-K) for the fiscal year ended June 30, 2025. LinkedIn revenue $17,812 million; LinkedIn has no separately reported operating income. www.sec.gov/Archives/edgar/data/789019/000095017025100235/msft-20250630.htm
  16. Snap Inc. Annual report (Form 10-K) for fiscal year 2025. Revenue $5,931,447 thousand; operating loss $532,167 thousand. Creator payments are included in “content and developer partner costs” but not quantified. www.sec.gov/Archives/edgar/data/1564408/000156440826000013/snap-20251231.htm
  17. Bilibili Inc. Annual report (Form 20-F) for fiscal year 2025. Net revenues RMB30,347,766 thousand (US$4,339,673 thousand); profit from operations RMB1,124,451 thousand; revenue-sharing costs RMB12,091,094 thousand (US$1,729,003 thousand), defined as fees paid to game developers, app stores and payment channels and shared with live hosts and content creators. Convenience rate US$1.00 = RMB6.9931. www.sec.gov/Archives/edgar/data/1723690/000119312526157842/d91984d20f.htm
  18. Pinterest, Inc. Annual report (Form 10-K) for fiscal year 2025. Revenue $4,221,767 thousand; income from operations $319,883 thousand. www.sec.gov/Archives/edgar/data/1506293/000150629326000021/pins-20251231.htm
  19. Reddit, Inc. Annual report (Form 10-K) for fiscal year 2025. Revenue $2,202,506 thousand; income from operations $441,984 thousand. www.sec.gov/Archives/edgar/data/1713445/000171344526000022/rddt-20251231.htm
  20. Space Exploration Technologies Corp. Prospectus (Form 424B4), 2026. AI segment (including X) advertising revenue $1,844 million for 2025; X’s total revenue and operating results are not reported separately. www.sec.gov/Archives/edgar/data/1181412/000162828026042639/spaceexplorationtechnologi.htm
  21. WARC Media. “Global Ad Spend Forecast: Q3 2026.” October 7, 2026 (public summary). Social media ad spend forecast to rise 21.3% to $394.6 billion in 2026. www.warc.com/en/article/global-ad-spend-outlook-q-3-2026-eb1a9505c8d34d1fb3833cf61f675165
  22. JOYY Inc. Annual report (Form 20-F) for fiscal year 2025. Filed with the U.S. SEC, April 28, 2026. Total net revenues $2,124,248 thousand; operating income $55,820 thousand; revenue sharing fees and content costs $967,624 thousand, which include payments to channel owners, performers and content providers and traffic costs to advertising network partners. www.sec.gov/Archives/edgar/data/1530238/000110465926049917/joyy-20251231x20f.htm
  23. Arriagada, A., & Ibáñez, F. (2020). “You need at least one picture daily, if not, you’re dead”: Content creators and platform evolution in the social media ecology. Social Media + Society, 6(3). doi.org/10.1177/2056305120944624